Introduction: The Stock Market’s “Speedometer”
Imagine driving a car with a speedometer that flashes:
- Red when you’re speeding (risk of a crash).
- Blue when you’re too slow (time to accelerate).
The RSI (Relative Strength Index) does the same for stocks—it tells you when a stock is overbought (too high) or oversold (too low).
But how does it work? And how can you use it? Let’s break it down.
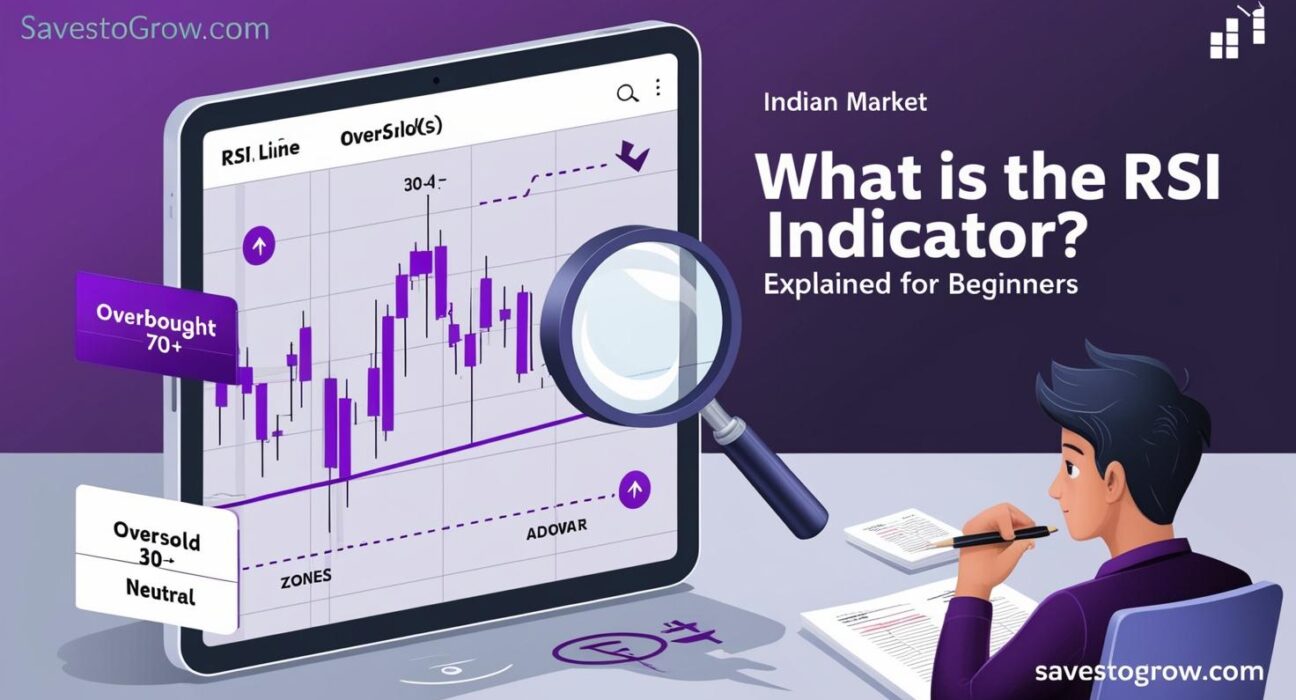
What Is the RSI Indicator?
The RSI is a momentum oscillator that measures how fast and how much a stock’s price moves.
- Range: 0 to 100 (like a percentage).
- Key Levels:
- Above 70 = Overbought (might fall soon).
- Below 30 = Oversold (might rise soon).
Example:
- If HDFC Bank’s RSI is 75 → It’s overbought (could drop).
- If ITC’s RSI is 28 → It’s oversold (could bounce back).
How Is RSI Calculated?
RSI compares recent gains vs. losses over a period (usually 14 days).
RSI = 100 – (100 / (1 + Average Gain / Average Loss))
✅ Don’t worry—you don’t need to calculate it manually!
✅ Charts (TradingView, Zerodha) show RSI automatically.
How Traders Use RSI
1. Spot Overbought/Oversold Stocks
- Sell Signal: RSI > 70 → Price may drop.
- Buy Signal: RSI < 30 → Price may rise.
2. Find Divergences
- Bullish Divergence: Price makes lower lows, but RSI makes higher lows → Reversal likely.
- Bearish Divergence: Price makes higher highs, but RSI makes lower highs → Drop likely.
3. Confirm Trends
- RSI stays above 50 in uptrends.
- RSI stays below 50 in downtrends.
RSI Trading Example (Reliance Industries)
- Scenario: RSI drops to 28 (oversold).
- Action: Traders buy, expecting a bounce.
- Result: Stock rises → RSI moves back to 50+.
Limitations of RSI
❌ Works best in sideways markets (not strong trends).
❌ Can give false signals (use with other indicators).
RSI vs. MACD
| Feature | RSI | MACD |
|---|---|---|
| Measures | Momentum (overbought/oversold) | Trend + Momentum |
| Range | 0–100 | No fixed range |
| Best For | Reversals | Trend-following |
How to Use RSI in Trading?
- Open a chart (e.g., TradingView, Zerodha Kite).
- Add RSI indicator (default: 14 periods).
- Look for:
- Overbought (70+) / Oversold (30-) zones.
- Divergences (price vs. RSI mismatch).
Final Takeaways
✔ RSI = Momentum indicator (0–100 scale).
✔ >70 = Overbought (sell signal), <30 = Oversold (buy signal).
✔ Use with other tools (trendlines, volume).
✔ Avoid relying on RSI alone.