
Technical Analysis Basics for Indian Traders: Charts, RSI & Stop Loss
Open any trading app and you’re met with candles, moving averages and an indicator called RSI. It looks like a language everyone else already speaks. This guide explains the core of technical analysis in plain English — what the charts are actually showing, the handful of tools worth knowing, and, just as importantly, where this whole approach stops being useful.
Quick answer
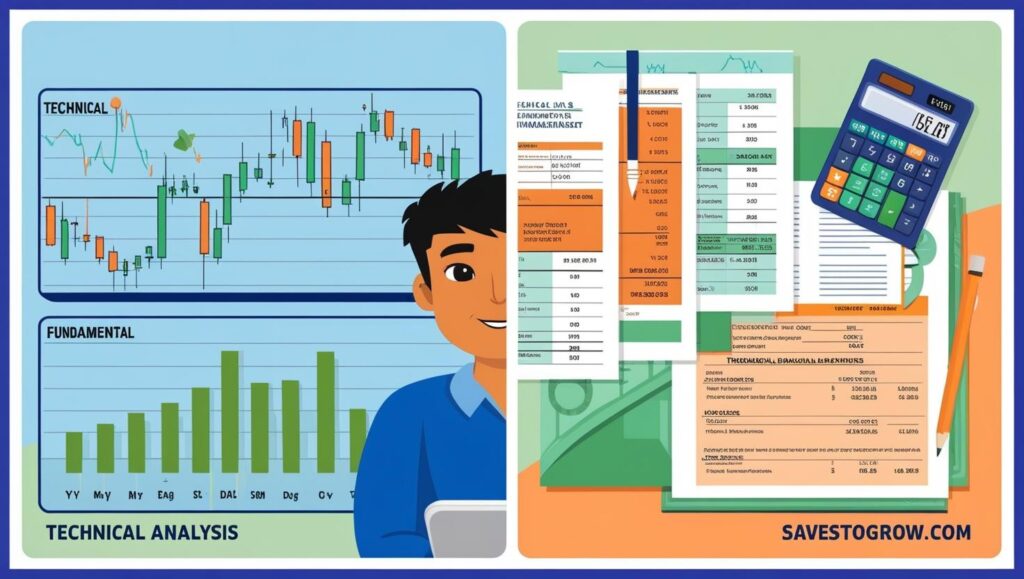
- Fundamental analysis asks what a company is worth. Technical analysis asks what the price is doing.
- Candlesticks show the open, high, low and close for a period — the story of one session.
- RSI measures momentum on a 0–100 scale; 70+ is “overbought”, 30− “oversold”.
- A stop loss is the price at which you admit the trade was wrong — decided before you buy.
- None of it helps a long-term SIP investor. It’s a tool for short-term trading, which most people lose money at.
Technical vs fundamental analysis
These are two different questions, not two rival religions.
| Fundamental | Technical | |
|---|---|---|
| Question it answers | What is this business worth? | What is the price doing right now? |
| Looks at | Earnings, debt, margins, management | Price, volume, trend, momentum |
| Typical horizon | Years | Minutes to months |
| Core assumption | Price eventually reflects value | Price already reflects everything known |
| Suits | Investors | Traders |
A long-term investor uses fundamentals to decide what to own — things like the P/E ratio and business quality. A trader uses technicals to decide when to enter and exit. Some people use fundamentals to pick the stock and technicals to time the purchase; that’s a reasonable combination, and quite different from staring at five-minute candles.
Candlesticks: reading one session at a glance
Each candle packs four numbers into one shape — the open, high, low and close for that period, whether the period is a minute or a month.
- The thick part (the body) spans the open and close. Green/white means the price closed higher than it opened; red/black means lower.
- The thin lines (the wicks) mark the highest and lowest points reached.
- A long body means one side dominated. A long wick means the price went somewhere and got pushed back.
That last point is the genuinely useful part. A candle with a long lower wick says sellers pushed the price down during the session and buyers bought it back up — which tells you something real about where demand sat, without any pattern-name mysticism.
You’ll see named patterns — doji, hammer, engulfing — and they’re worth recognising. But be honest about what they are: descriptions of what just happened, not predictions of what happens next. A pattern spotted without the surrounding trend and volume is close to a coin flip.
RSI: measuring momentum
The Relative Strength Index compares the size of recent gains with recent losses — usually over 14 periods — and expresses it on a scale of 0 to 100.
| RSI | Conventional reading | What it really means |
|---|---|---|
| Above 70 | “Overbought” | Price has risen fast recently — not a sell signal |
| 30–70 | Neutral | No strong momentum either way |
| Below 30 | “Oversold” | Price has fallen fast recently — not a buy signal |
The mistake beginners make is treating 70 and 30 as instructions. In a strong uptrend RSI can sit above 70 for weeks while the price keeps climbing — selling every time it crosses 70 means selling every winner early. Treat these levels as a prompt to look more closely, not a trigger.
The more interesting use is divergence: price makes a new high but RSI doesn’t, suggesting the move is running out of participants. Still not a guarantee — a hint worth noticing.
You never calculate any of this by hand. Every charting platform draws it for you.
Stop loss: deciding in advance when you’re wrong
A stop loss is an order that sells automatically if the price falls to a level you set. Its real function isn’t mechanical — it’s psychological. It forces you to answer, before you’re emotionally invested, the question people are worst at answering mid-trade: at what point do I accept I was wrong?
Two workable ways to place one:
- Technical — just below a recent swing low or support level. If the price breaks that, the reason you bought no longer holds.
- Percentage — a fixed loss you accept per trade, often 5–8%. Cruder, but easy to stick to.
Two things to avoid. Don’t set it so tight that ordinary daily noise takes you out of a position that was fine. And never move a stop loss down to avoid taking a loss — that single habit turns small manageable losses into the ones that genuinely hurt.
Also worth knowing: a stop loss is not a guarantee. If a stock gaps down overnight or hits a circuit limit, your order can execute well below the level you set — or not at all.
Circuit breakers: when the market stops trading
India’s exchanges halt trading when prices move too far too fast. Individual stocks have price bands (commonly 5%, 10% or 20%), and there are index-wide circuit breakers that pause the entire market:
| Nifty/Sensex moves | What happens |
|---|---|
| 10% | Trading halted — duration depends on the time of day |
| 15% | A longer halt |
| 20% | Trading stops for the rest of the day |
They exist to interrupt panic — to stop a fall feeding on itself and give everyone time to think. For a trader they matter practically: when a stock is stuck at its circuit limit, there may be no buyers at all, so you cannot exit at any price. That is precisely when a stop loss fails to protect you.
The honest limits of all this
Technical analysis is a genuine skill, and this next part matters more than any indicator above.
SEBI’s own studies have repeatedly found that the large majority of individual traders in the equity derivatives segment lose money. Charts do not change that arithmetic — costs, taxes and the speed of professional participants are working against you on every trade.
If your goal is to build wealth over years rather than to trade, none of this is where your attention belongs. Your outcome is decided by how much you invest, for how long, and at what cost — not by whether you spotted a hammer candle. A monthly SIP into a low-cost fund and twenty years of not interfering beats almost every active trading record, and requires no charts at all. That’s the case made in why long-term investing wins.
Learn technicals if trading genuinely interests you, with money you can afford to lose. Just don’t confuse it with investing.
Frequently asked questions
What is the difference between technical and fundamental analysis?
What does RSI above 70 or below 30 mean?
Do candlestick patterns actually work?
Where should I place a stop loss?
Is technical analysis useful for long-term investors?
What is a circuit breaker in the Indian stock market?
Related reading
- What is intraday trading?
- How to read a stock quote on the NSE
- Penny stocks and how they’re manipulated
- Why long-term investing wins
Educational information, not trading advice. Trading carries a real risk of loss — most individual derivatives traders in India lose money.

Prashant Thakur is the founder of SavesToGrow.com. He is not a financial advisor — he's a self-taught personal-finance enthusiast who learned to budget, save consistently, and invest from scratch, and now shares those hard-won lessons in plain, jargon-free English. Every guide is researched from primary sources such as the Income Tax Department, SEBI, RBI and AMFI, and reflects real, first-hand experience. Nothing on this site is professional financial advice — always do your own research or consult a SEBI-registered advisor before making money decisions.